Fieldlock is a desk for the surveys you run. Every screen below is
the real desk on the Harborline sample, a made-up food packing
study with two seasons. Nothing here is a mock-up.
1
Add the study
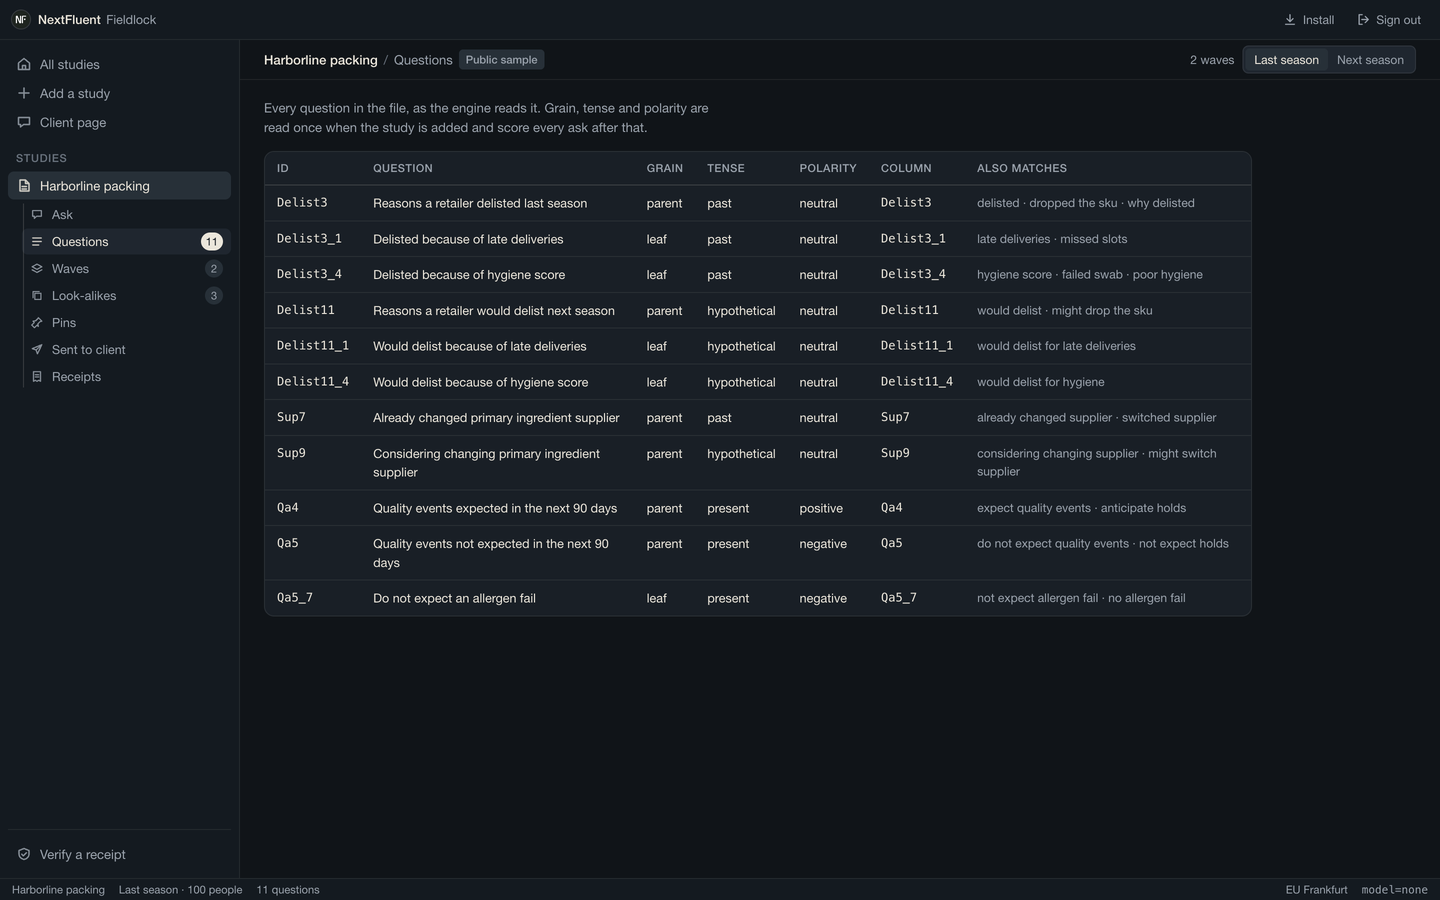
Drop the SPSS file. A .sav carries the question wording and the
answer labels, so nothing has to be typed in. A CSV works too,
with a labels file if it has none of its own. The desk reads
every question once and notes its grain, its tense and its
polarity. Those notes score every question you ask afterwards.
A second file is the next wave. Each wave stays its own file,
with its own people and its own columns. A question that was not
asked on a wave has no figure on that wave.
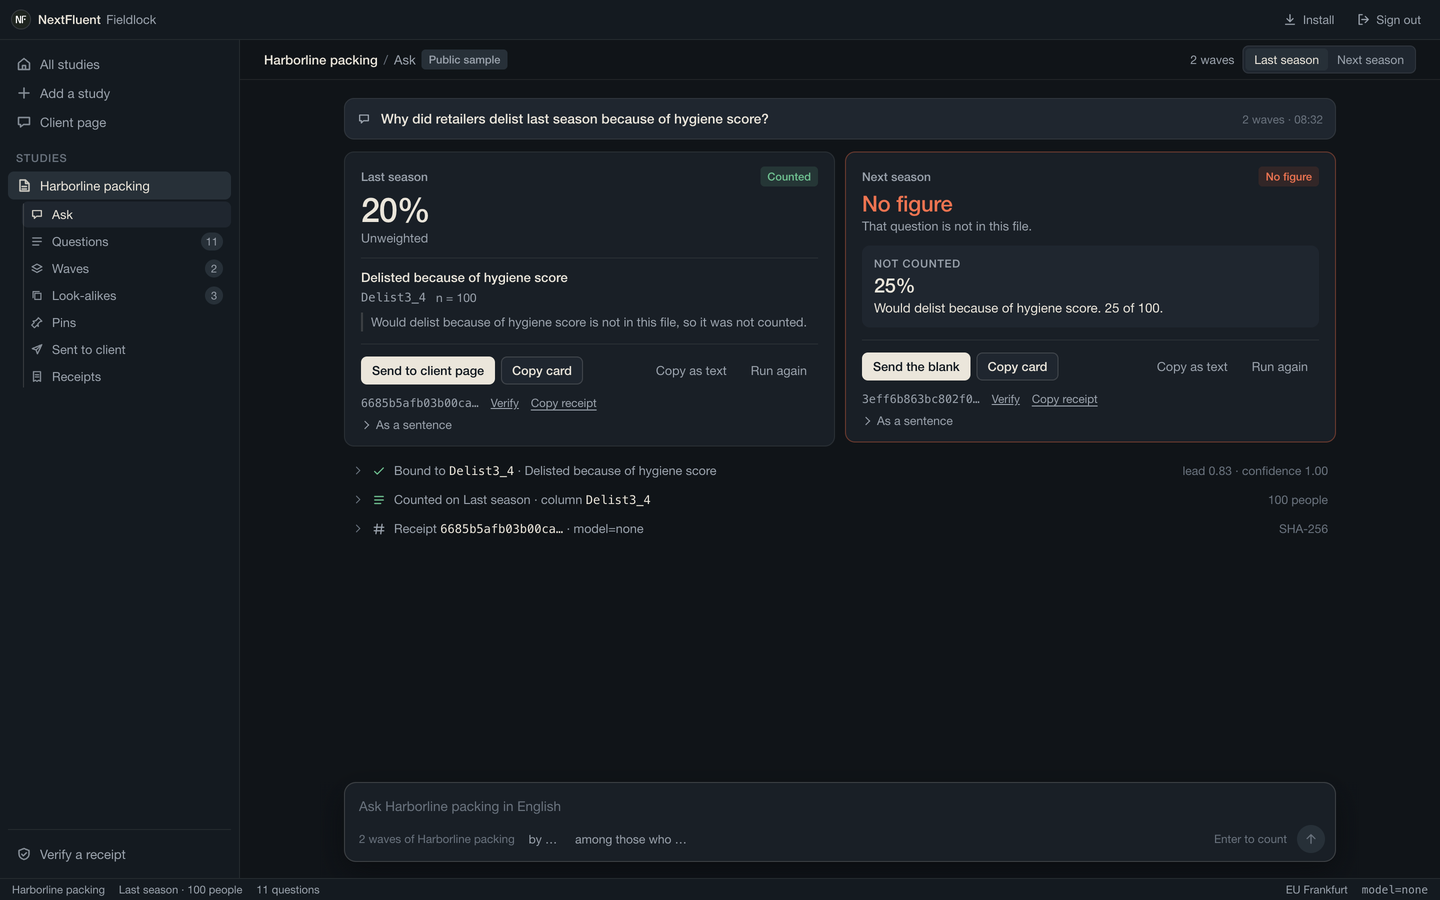
Type the question the way your client says it on the phone.
Back comes one card per wave. Where the question was asked you
get the figure, the wording it was counted from and how many
people it rests on. Where it was not asked the card stays blank
and names the look-alike it refused to count, with the
percentage you would have been handed by mistake.
Add “by region” and the figure is cut, with a letter on each
column and the 95% test between them. Add “among those who
changed supplier” and the base narrows to those people. Ask for
the mean and a scale comes back as a mean.
One question, two waves. 20% where it was asked, no figure where it was not.
3
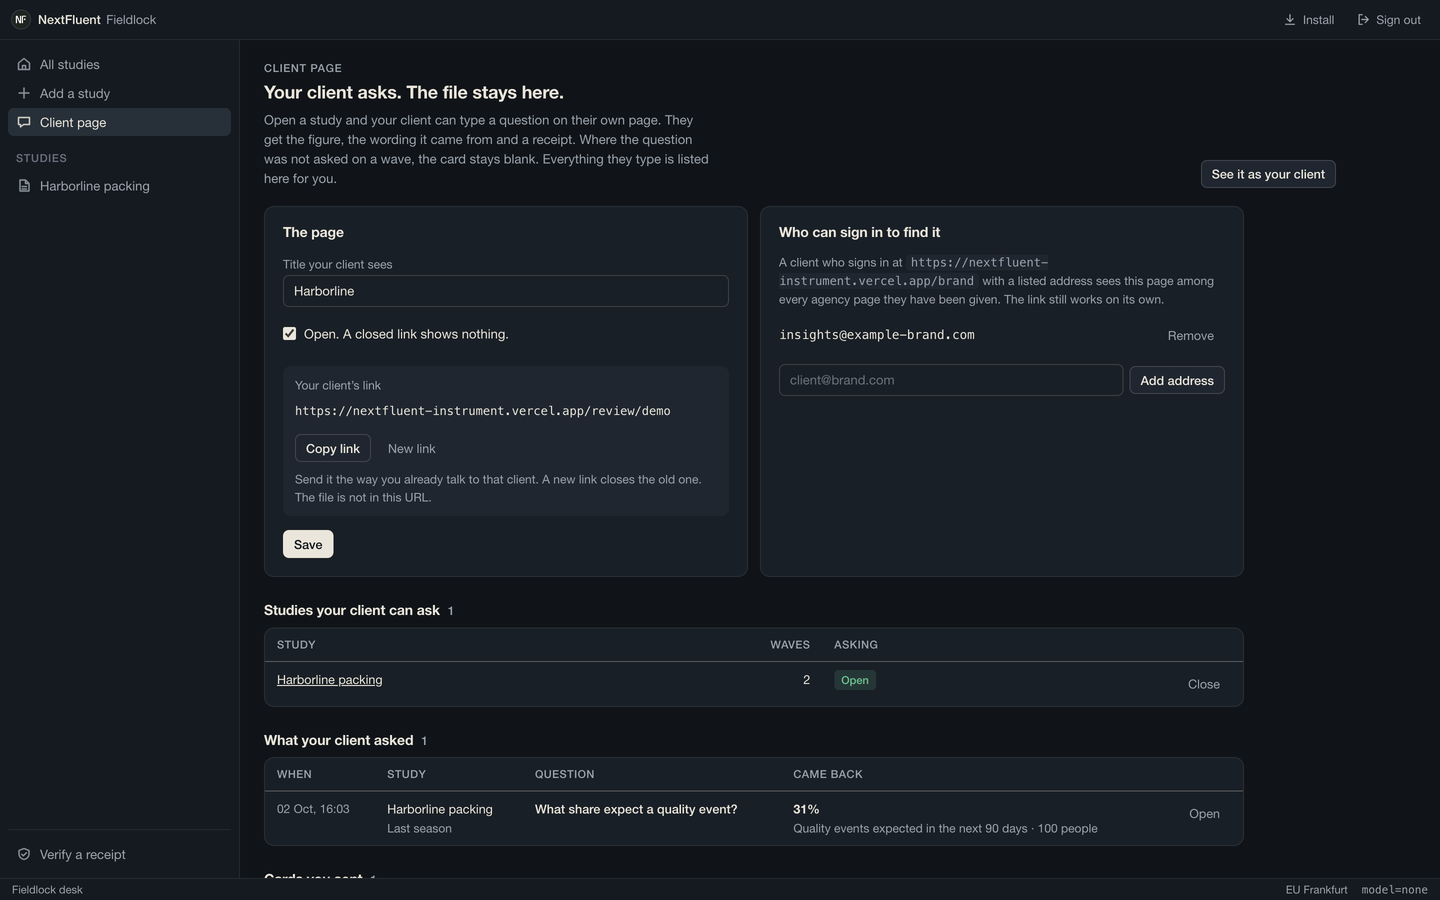
Give your client the page
Each client gets one page. They read the cards you sent and,
when you open a study to them, they type their own questions
and get answers under the same rules. Every question they ask is
listed on your desk before the next call.
The page carries figures, wording, bases and receipts. It never
carries the file. You can close the link at any time, and a new
link closes the old one.
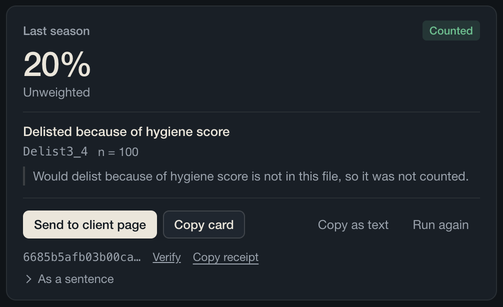
A figure on its own is a claim. A figure with its wording, its base
and its receipt is a finding. Every card on the desk, and every card
your client sees, is built the same way.
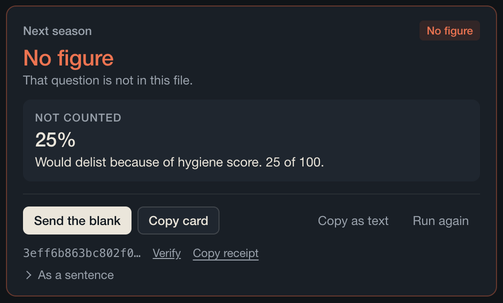
The wave. Which file this card was counted on. Nothing is ever blended across waves.
The figure. A percentage, a named box on a scale, or a mean. Weighted when the file carries a weight, with the unweighted figure beside it.
The wording. The exact question the figure was counted from, with its id in the file and the number of people it rests on.
What was left out. When a look-alike question sits in the file, the card says so, so nobody mistakes one for the other.
The actions. Send it to your client’s page, copy it as an image for the deck, or copy it as one plain sentence.
The receipt. A SHA-256 hash over the study, the wave, the question, the field, the base and every row. Run it again in a year and the hash matches.
No figure. The question you asked was not put to people on this wave, so there is nothing honest to count.
Not counted. The look-alike that is in the file, named, with the percentage a chat on the file would have given you. Here, 25%.
Send the blank. A blank is a finding too. Your client sees that the question was not asked, instead of a number from the wrong question.
The receipt. A refusal gets a hash as well, so the blank can be verified like any figure.
Waves stay apart.
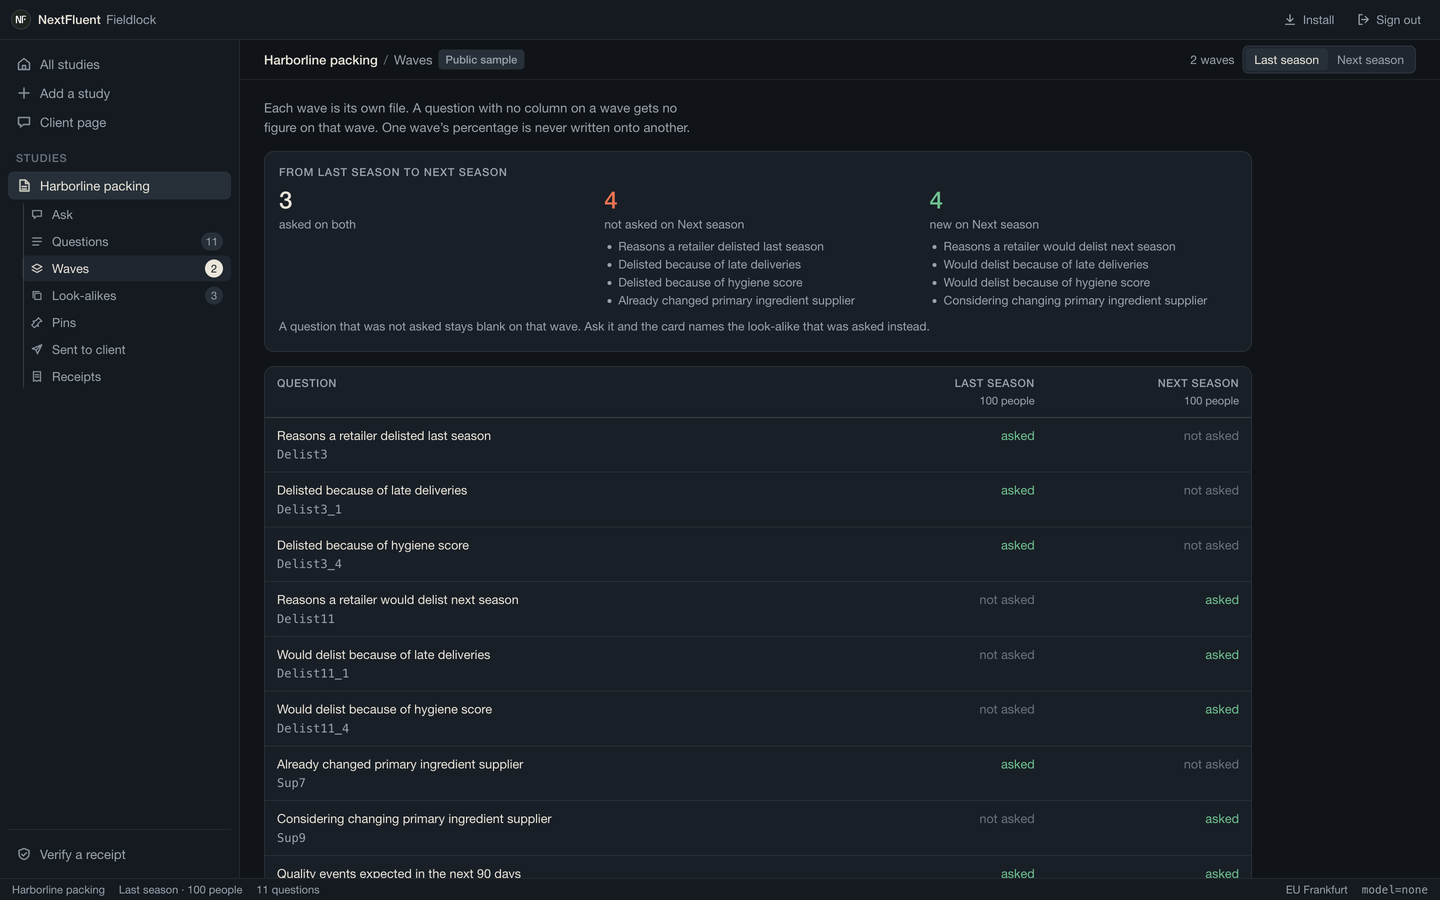
The Waves tab shows what changed between two files: which
questions were asked on both, which were dropped, which are new.
When you ask, each wave answers for itself. With two waves the
card says whether the move between them is a real change at the
95% level or within what chance would give. With three or more
it draws the line.
Two questions that read alike are listed as look-alikes, with
the cue words that tell them apart. When an ask lands too close
between two of them, the desk does not pick. It shows both and
asks you to pin one. From then on that wording binds to the
question you chose.
What changed from one season to the next.
What the desk will not do.
Guess the question
When a question names something the study never asked about,
the answer is no figure, with the reason. When two questions
score too close together, you are asked to pin one. A nearest
column is never quietly chosen.
Blend waves or studies
One figure comes from one file. Ask across every study on your
login and each study answers on its own tile. One wave’s
percentage is never written onto another.
Let a language model write the number
Every count is arithmetic on the rows of the file. No language
model sits on the number path, and every receipt says so:
model=none. Nothing you upload is sent to ChatGPT.
Try the sample, then bring a file.
The Harborline sample runs on the homepage without a login. Your own
file can be counted in your browser there too, with nothing
uploaded. The desk is where your real studies live.
 NextFluent