A chat on the file
25%
Would delist because of the hygiene score. 25 out of 100. That’s the question in the file.
Fieldlock
Your client wants one more number before the call. Type the
question the way they said it; back comes the count, the wording
it was counted from, how many people, and a receipt. Where that
question was not asked on the wave, the card stays blank, names
the look-alike it refused, and shows the figure a chat would have
given you. No language model reads the file, the question or the
answer; every receipt says model=none. The file
stays with you, in Frankfurt, and your client reads the cards on
a page of their own.
On live studies
 MarketCulture
This is the real engine, running in your browser on a made-up study. Harborline is a food packing survey with two seasons. Look at the Next season card first. That 25% is the figure a chat on this file would have counted. Fieldlock shows it as not counted and leaves it out. Then ask it anything.
 NextFluent Fieldlock
Public sample
Sign in
NextFluent Fieldlock
Public sample
Sign in
Counting 100 rows in this tab.
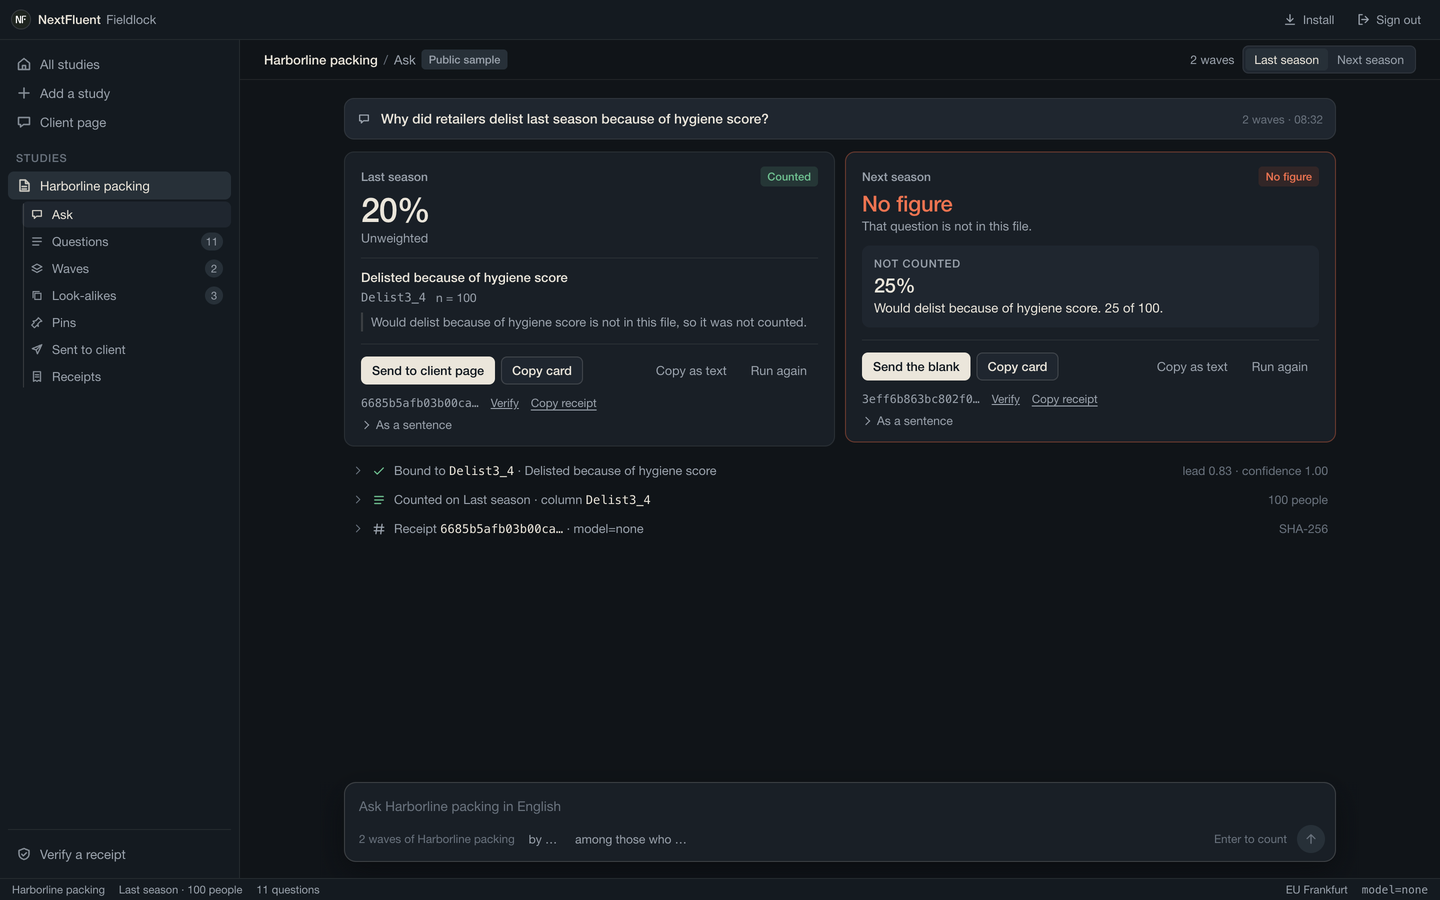
Last season you asked retailers why they delisted. Twenty out of a hundred said the hygiene score. Next season that question was not asked. The file does hold a look-alike: would they delist if the hygiene score were poor. Twenty-five out of a hundred said yes. A chat on the file counts that one and tells you 25%.
A chat on the file
25%
Would delist because of the hygiene score. 25 out of 100. That’s the question in the file.
Fieldlock
No figure
We put that question’s name on the page, show its 25% as not counted, and leave it out.
Last season, the question you asked is in the file. 20 out of 100 said yes. Unweighted. The wording sits under the number, and the receipt under that.
Where the question you asked is in the wave, you get the percentage. Where it is missing, the card stays blank, names the look-alike it would have been given by mistake, shows that figure as not counted, and prints the wording that makes it a different question. You see the 25% a chat would have handed you, and the question it really answers.
Every figure is arithmetic on the rows of your file. Your
English is bound to a question by scoring it against the
wording and the answer labels in the file. No model reads the
file, the question or the answer, and nothing you upload is
sent to one. The receipt under each figure says
model=none, and that line is there for your
client to read as well.
Under each percentage sits the wording it was counted from, how many people answered, and a hash. Your client reads the card on the page you give them, and anyone holding the receipt can paste it at app.nextfluent.com/verify, with no login, and watch it re-hash. Run the question again in a year and the hash matches.
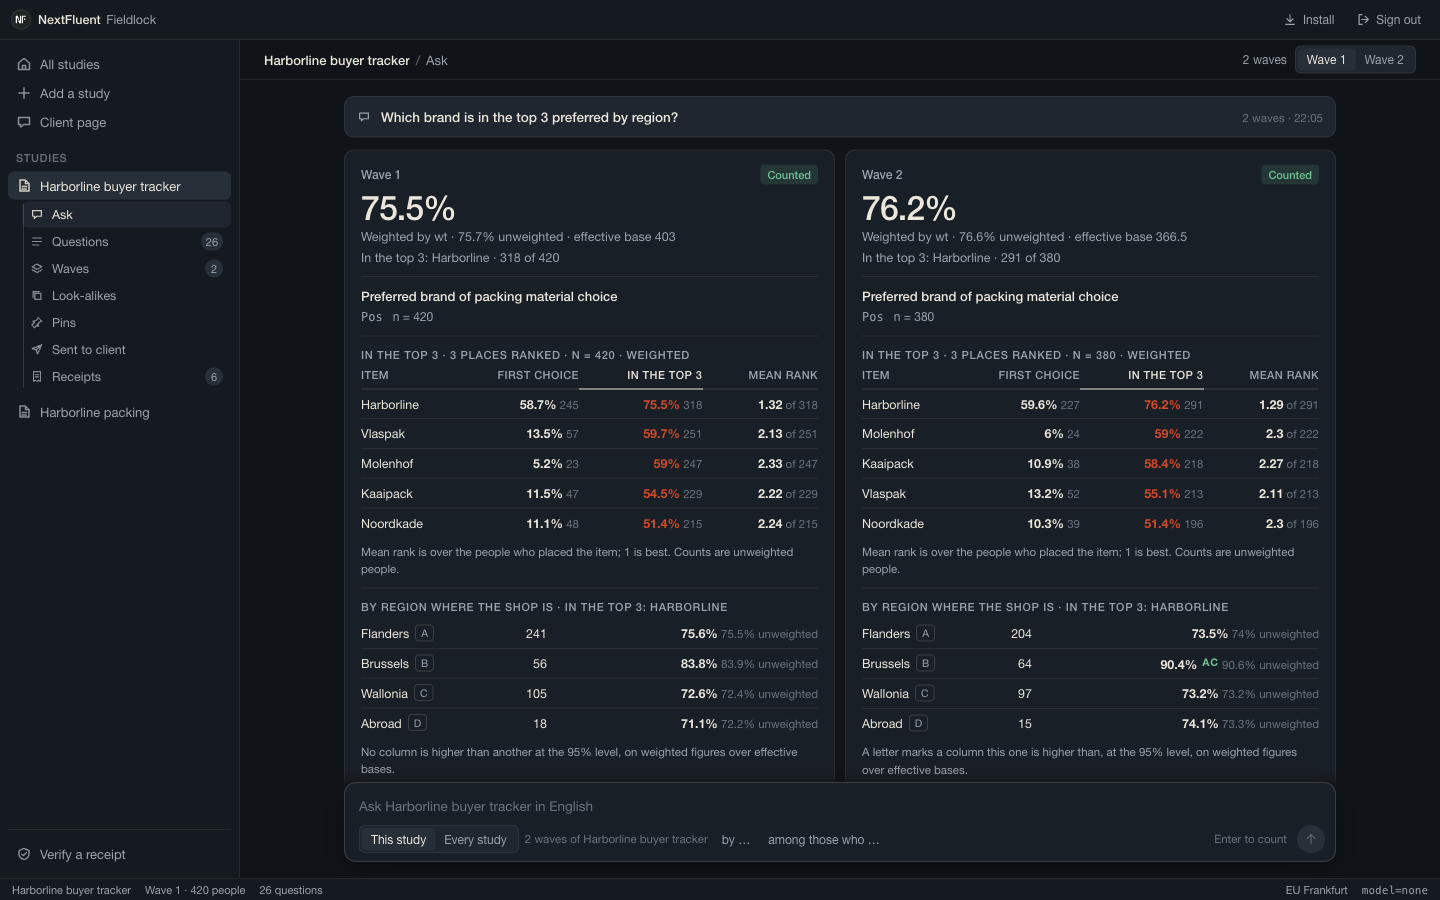
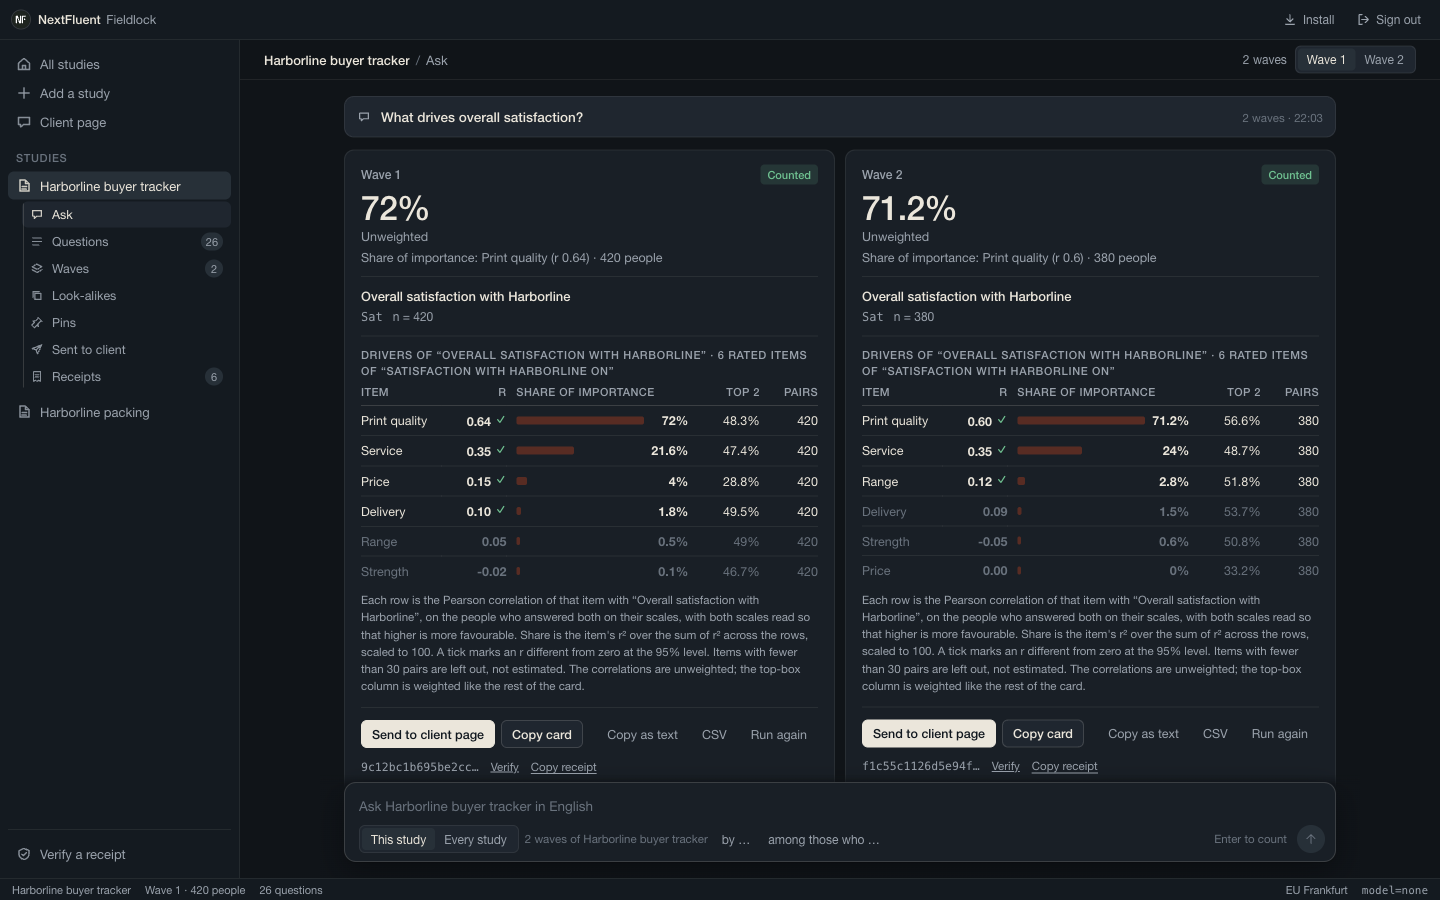
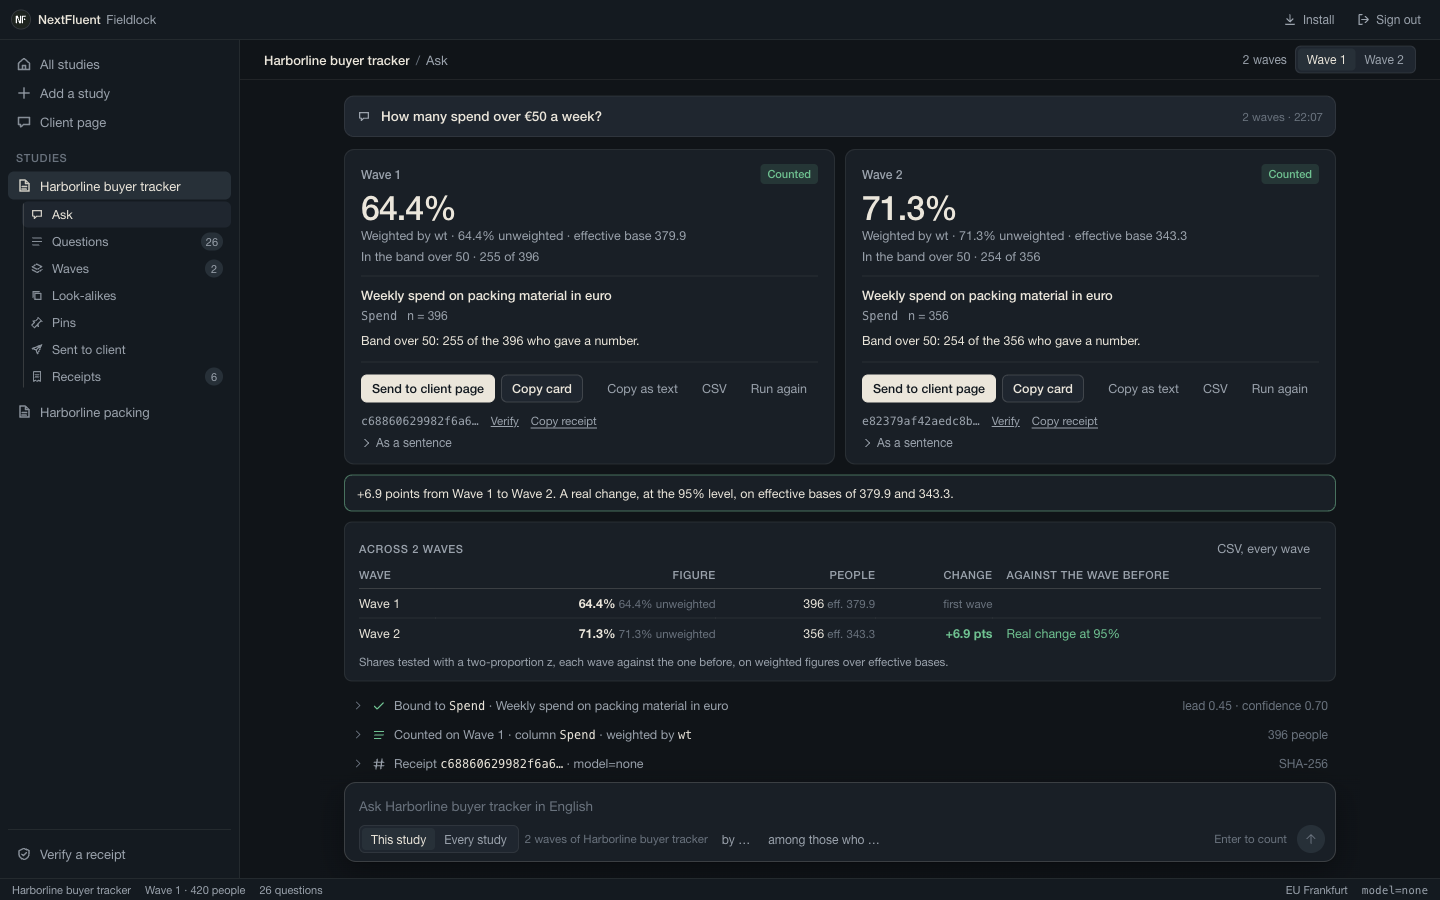
Your studies down the side, your questions in a thread, one card per wave, and under each card the steps that produced it. The screens below are the real desk on the Harborline sample and on a second made-up tracker with two waves.
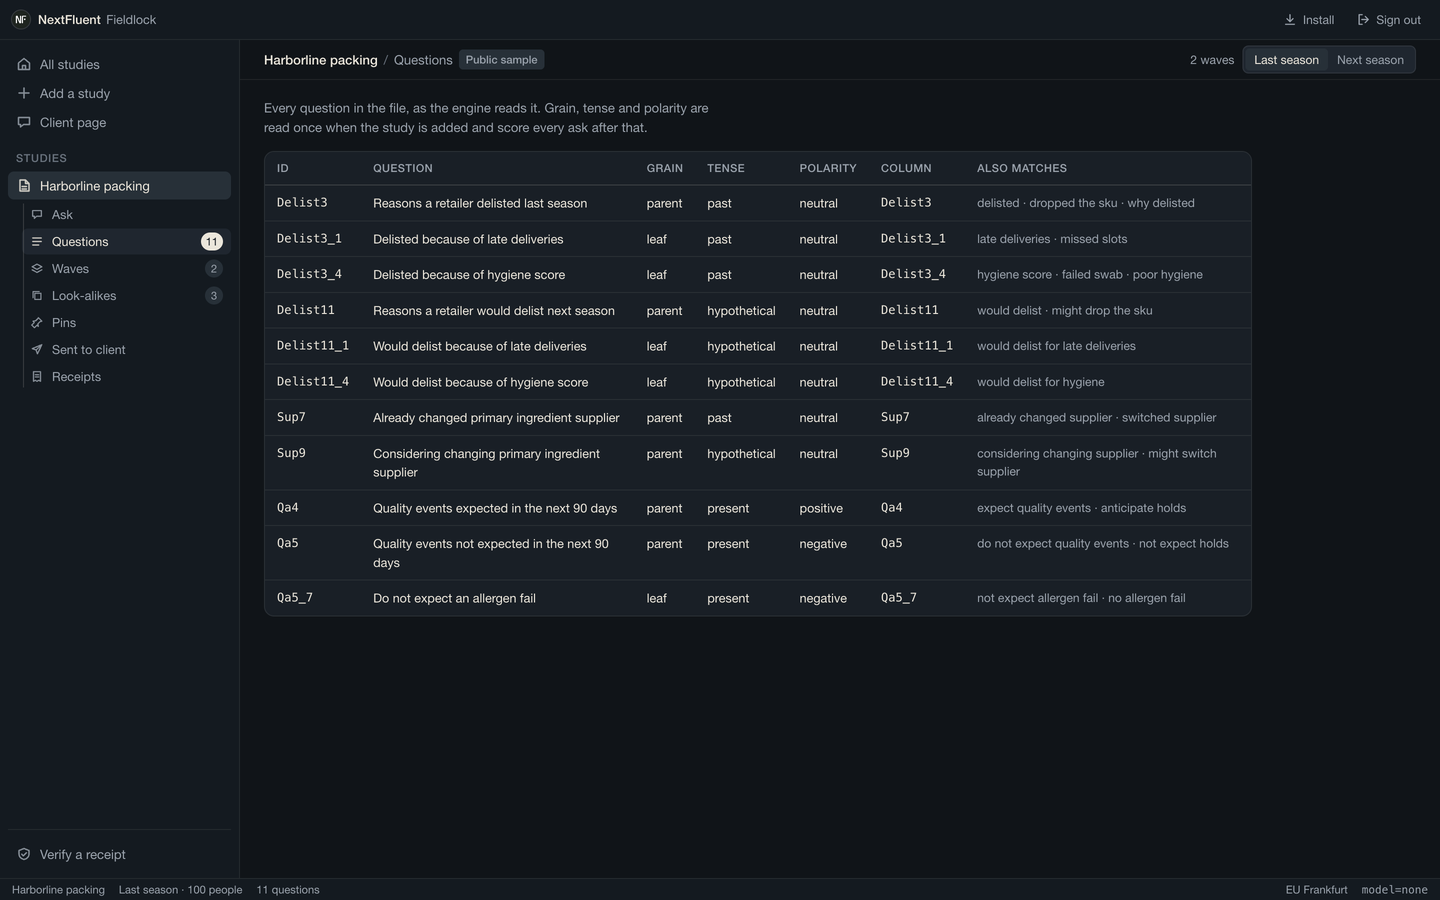
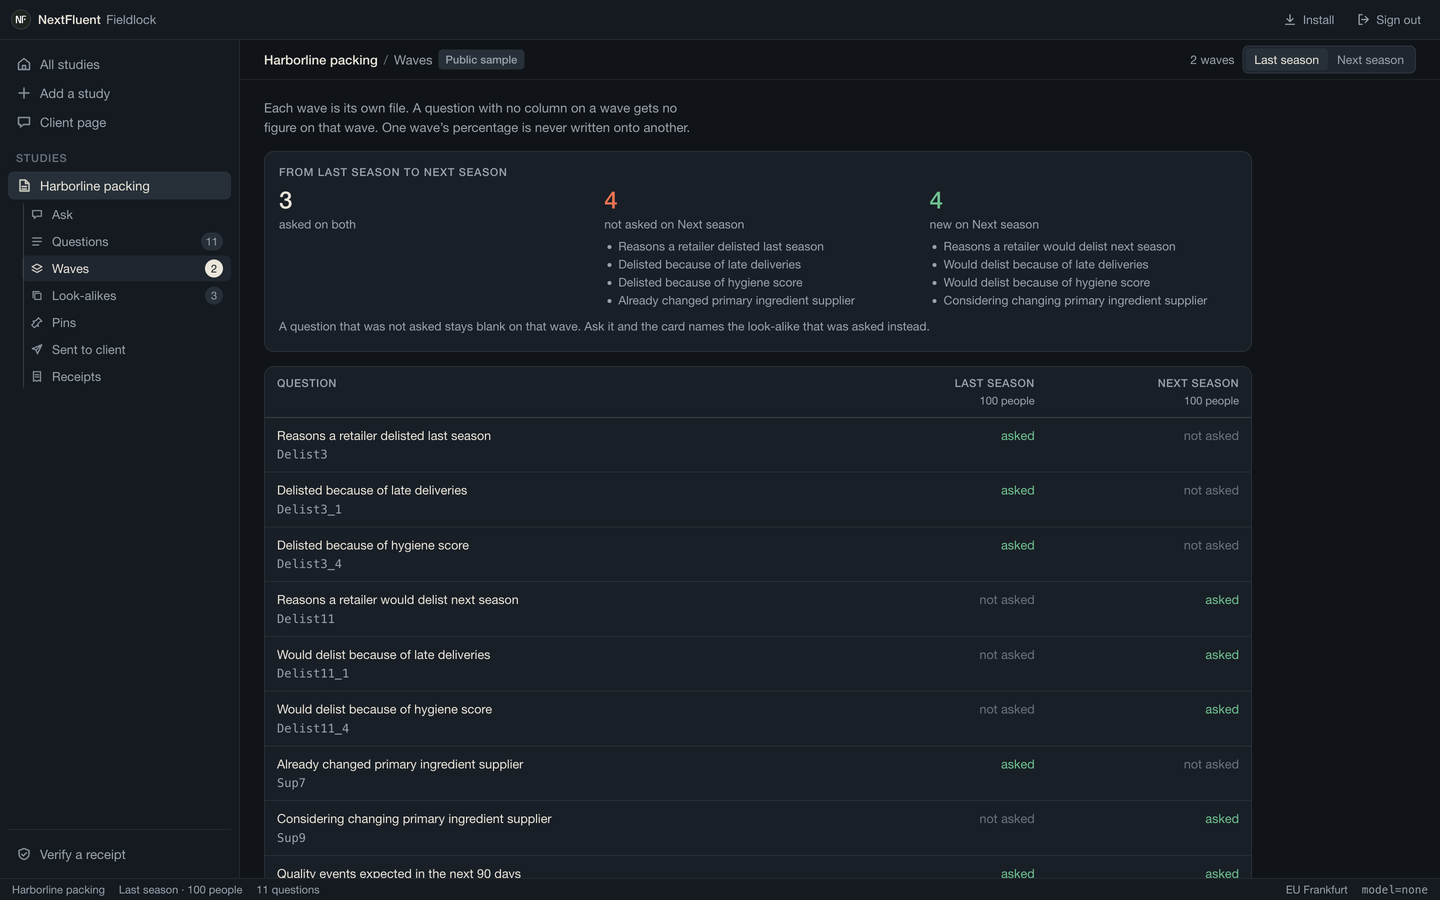
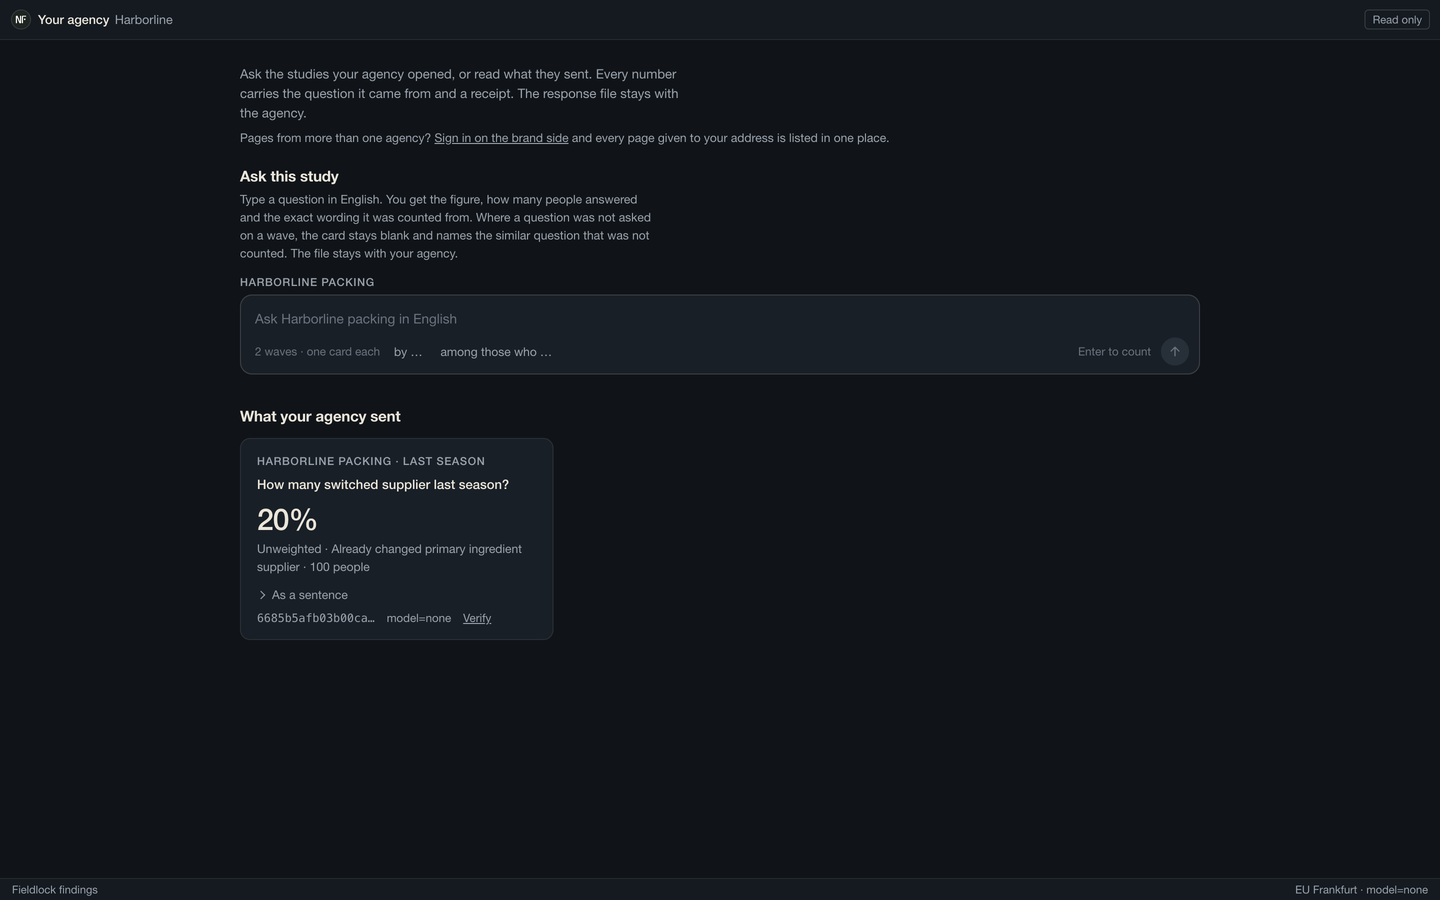
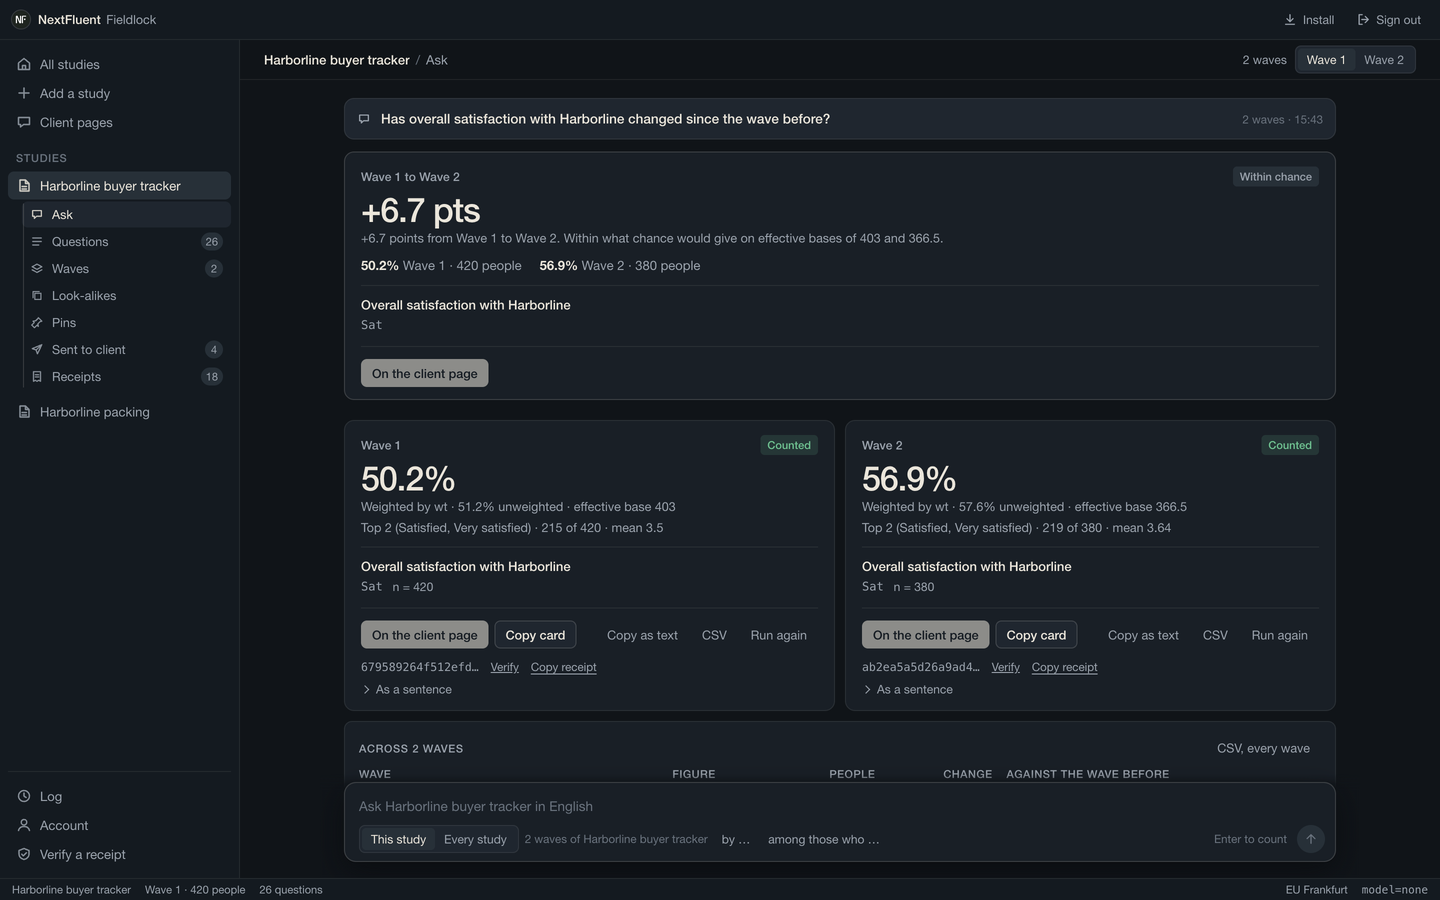
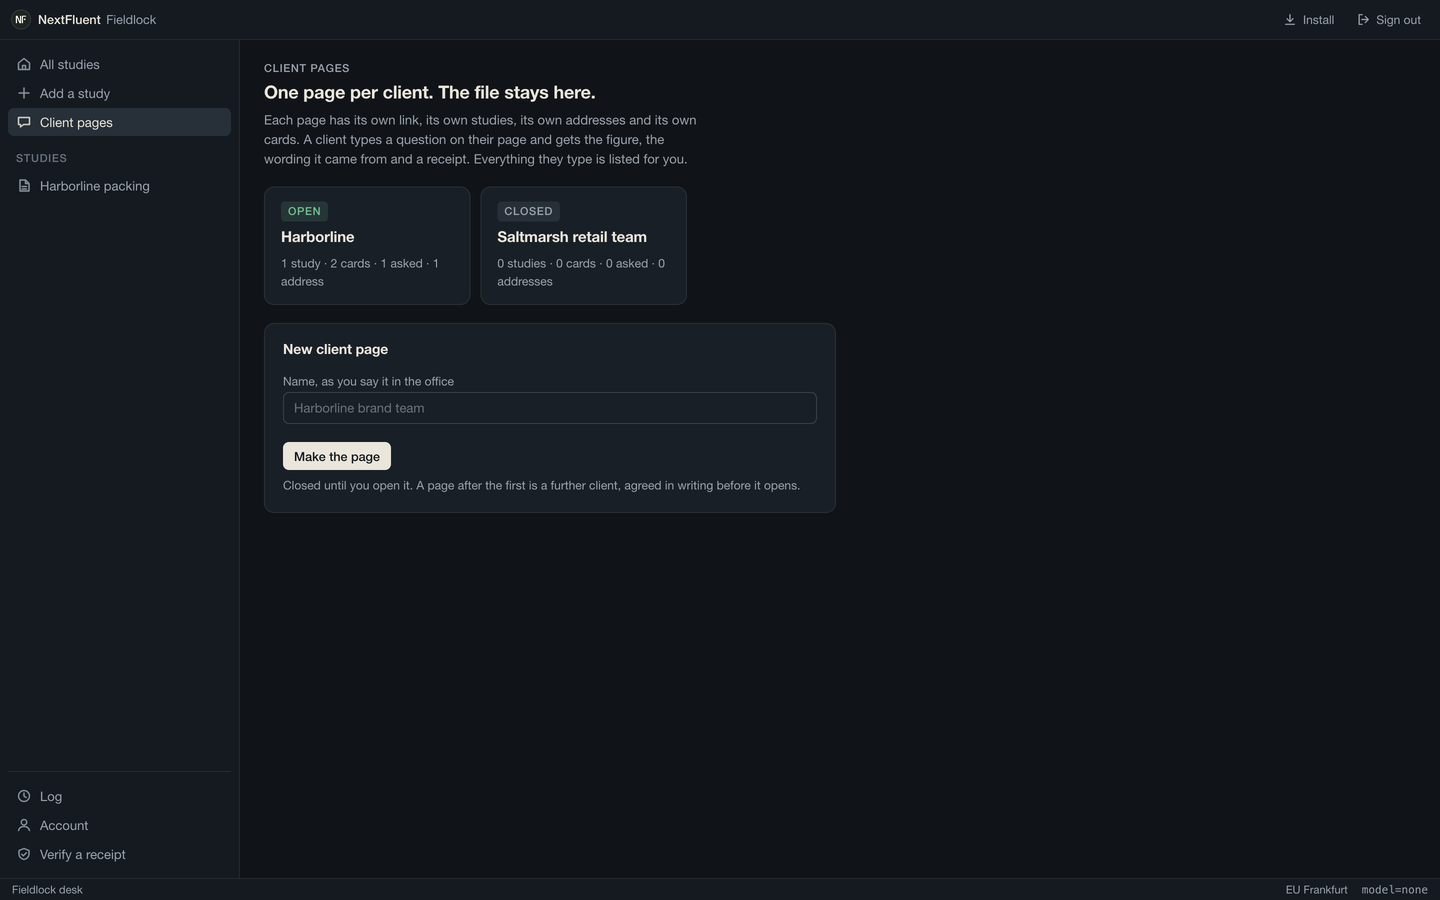
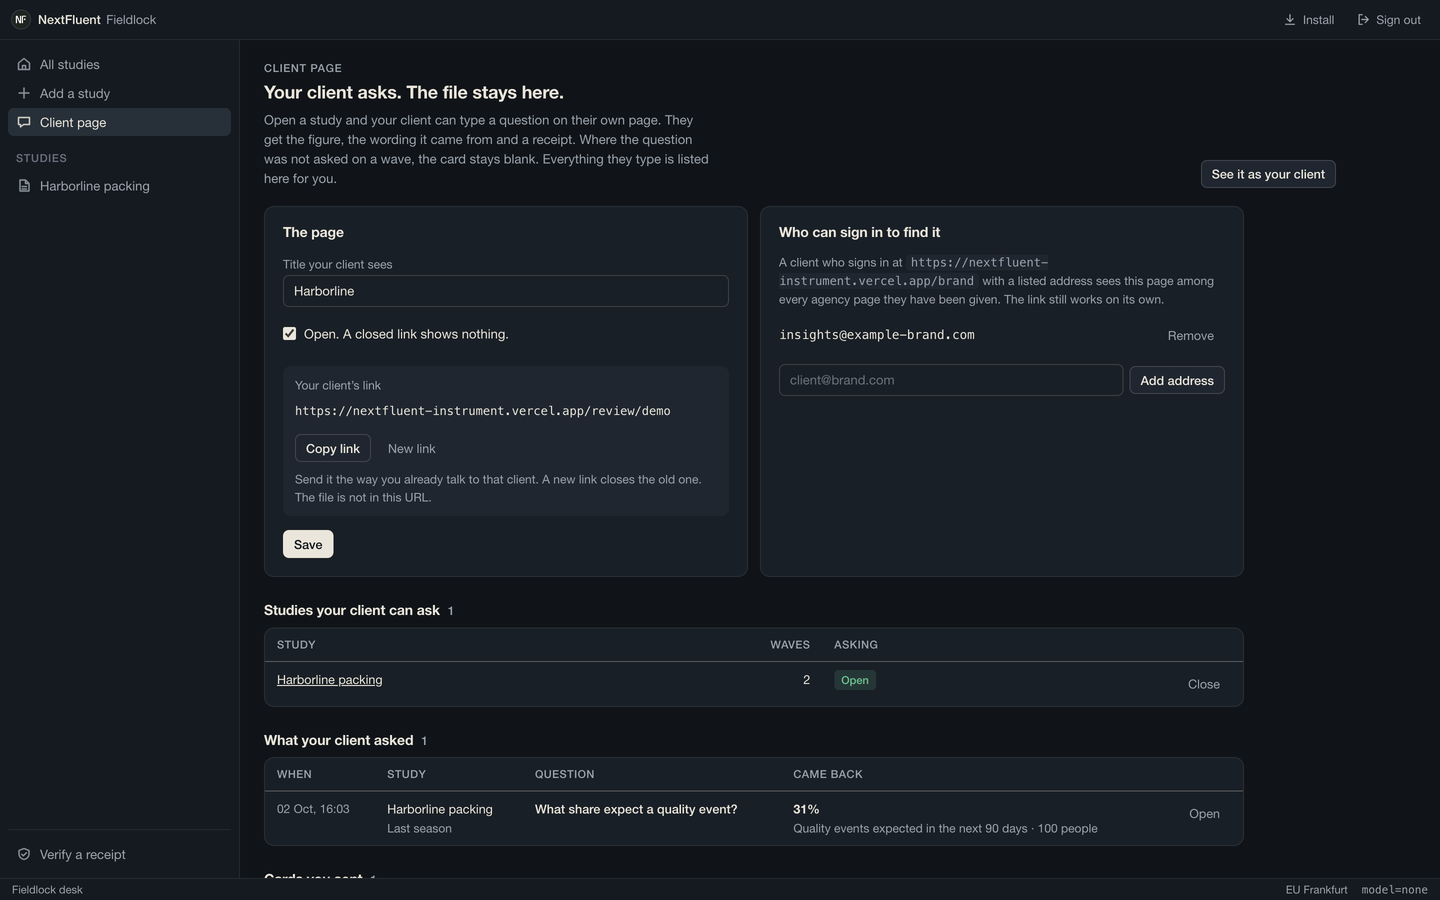
The sample above is one made-up study. The desk is where your real studies live, and where the people who work them sign in.
Drop the SPSS file. It carries the question wording and the answer labels, so there is nothing to type in. A CSV works too. Add the study you are working on, or every study you run.
Ask one question across all of them and each study answers on its own. We never blend two studies into one percentage.
Type the question the way your client says it on the phone. Back comes the figure, how many people, and the wording we counted. When a question was put to some people only, the card says who, worked out from the file itself: “Asked only of the 484 who ticked the brand on the awareness question.” A weight in the file is applied and named. A 1–5 question comes back as a named box or a mean. An amount comes back as a mean, or as the share over €50, with the refused codes left out. A ranking question comes back as a table of first choice, top three and mean rank. Ask what drives a score and the card carries the drivers table.
Add “by plant” to cut it, with a letter on each column and the 95% test between them. Add “among those who changed supplier” to narrow it. Ask whether something changed since the wave before and the change comes back as a card of its own: the points moved, and whether that is more than chance on these bases. With three or more waves it draws the line.
One page per client, each with its own link, its own studies and its own cards. They read what you sent, and they can ask for themselves. You see every question they typed before the next call.
List their work email and they sign in once to find every page they have been given. See a client page.
Drop a response file from any survey tool. Your browser reads it and counts it right here. Nothing is uploaded and nothing leaves this tab. Drop a second file and you have two waves.
NextFluent Fieldlock
Your file · read in this tab
Drop an SPSS .sav or a CSV here or .
An SPSS file brings its own question wording and answer labels, so nothing has to be typed in. A CSV works too: one row per person, one column per question. Drop a labels file with it, two columns, column name and question wording, and each question gets its wording. A second file is the next wave. The file’s weight is applied, with the unweighted figure beside it.
Nothing loaded
This is the free version. The desk keeps your studies, lets you pin wording, and gives your client a page. See pricing.
The researcher and the account lead sit at the same desk, each with their own password and authenticator. The log says which of them sent the card. A colleague is €600 a year, agreed in writing before they sign in.
You run the study and you answer for the numbers. The desk gives you a figure with its wording and base in the time it takes to type the question, and refuses when the honest answer is no figure. Pins keep your decisions.
You are on the phone when the client asks. Ask the desk the way they said it, copy the card into the deck, and send it to their page. Every question they typed themselves is listed before the next call.
You get one page from your agency. On it, the cards they sent and a box to ask your own question. Every number carries the question it came from and a receipt you can check. The file stays with the agency.
An SPSS .sav, which brings its own wording and labels. Or a CSV, with a two-column labels file if it has none. A weight in the file is applied and named. More on files.
Onto your desk, on a server in Frankfurt, under your login. Nothing from it is sent to a language model. Your client sees the cards you send and the answers to their own questions; the file itself stays with you. Security and data.
That this figure came from this study, this wave, this question, this field and these rows. Run it again in a year and the hash matches. How we count.
The desk is €2,400 a year for one seat. With a page for one client it is €3,600. A further seat is €600 a year and a further client is €1,200, both agreed in writing. We set up your first study with you, on a call, in an afternoon.